Perdue School of Business Chilled Water
Salisbury University — Salisbury, Maryland
Perdue School of Business
Improved efficiency of the chilled water system at the new Perdue School of Business at Salisbury University through the use of PIC‑V® and MVP™ pressure independent control valves.
Project Overview
The Facility
This project included construction of the new Perdue School of Business and supporting infrastructure for Salisbury University. The facility provides approximately 112,800 square feet of classroom, assembly, lab, administrative, and general use areas to support current and projected undergraduate, graduate, and executive education programs. The project was designed to achieve LEED® Green Building Gold certification.
Chilled Water Plant
The chilled water system is variable primary flow, consisting of two 150-ton McQuay magnetic bearing variable speed chillers operating at a 50/50 load split, two cooling towers with variable speed fans, two redundant variable speed chilled water distribution pumps, and three condenser water pumps (one as a common backup). The system serves various air handling unit (AHU) and fan coil unit cooling coils, with AHU chilled water flow controlled by Griswold Controls PIC‑V® and MVP™ pressure independent control valves.
Air Distribution Systems
The air distribution system consists of five Variable Volume AHUs with zone reheat coils and one Single Zone Variable Volume AHU. AHUs 1, 4, 5, and 6 serve classrooms, offices, and general areas — each equipped with variable volume static pressure controlled supply fans, volumetric return fan tracking, energy recovery wheels, preheat coils, chilled water coils, air side economizers, and demand controlled ventilation. AHU-2 serves the auditorium exclusively, with a variable volume temperature controlled supply fan, preheat coil, chilled water coil, reheat coil, air side economizer, and demand controlled ventilation.
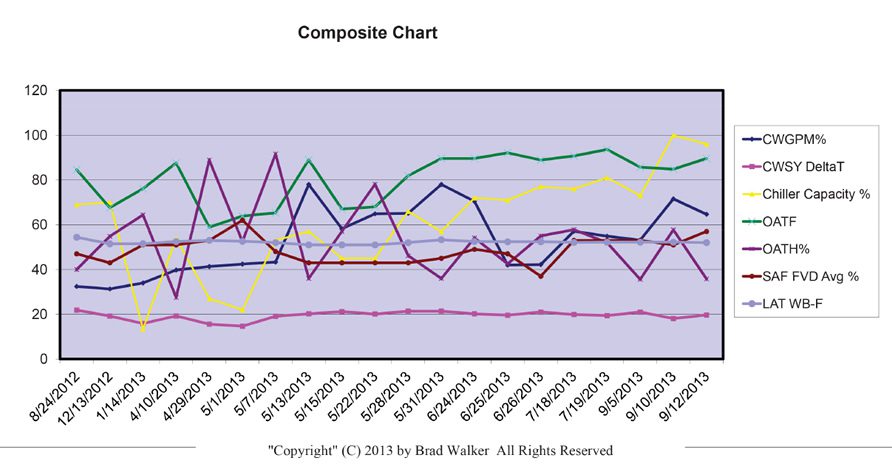
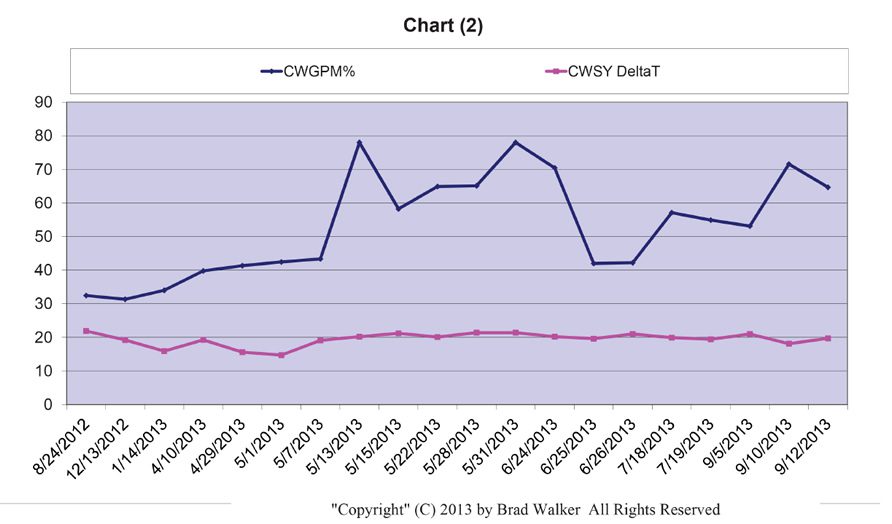
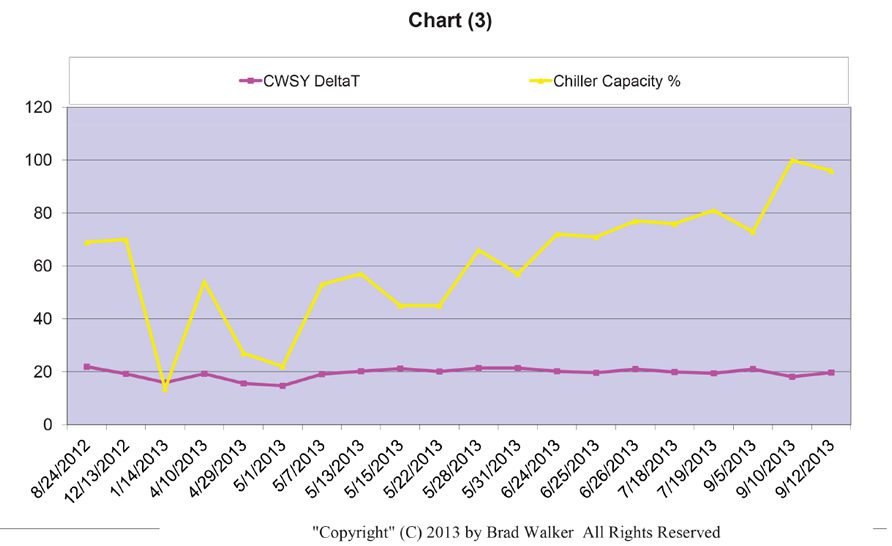
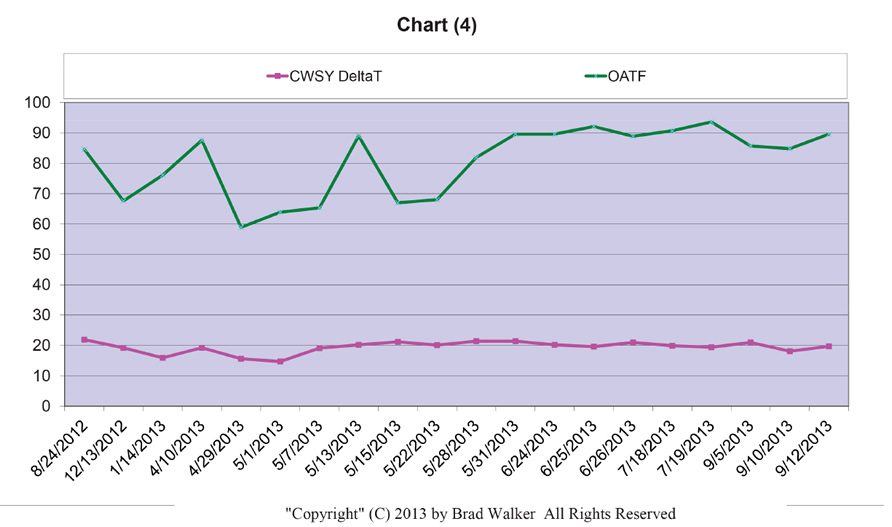
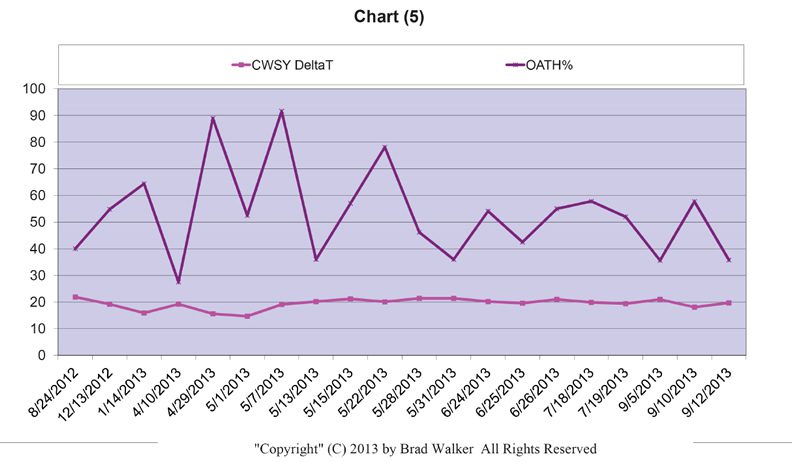
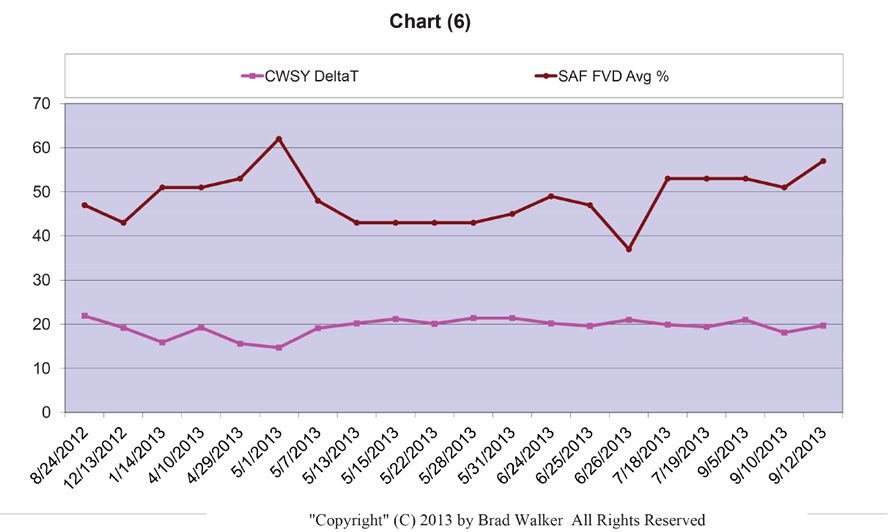
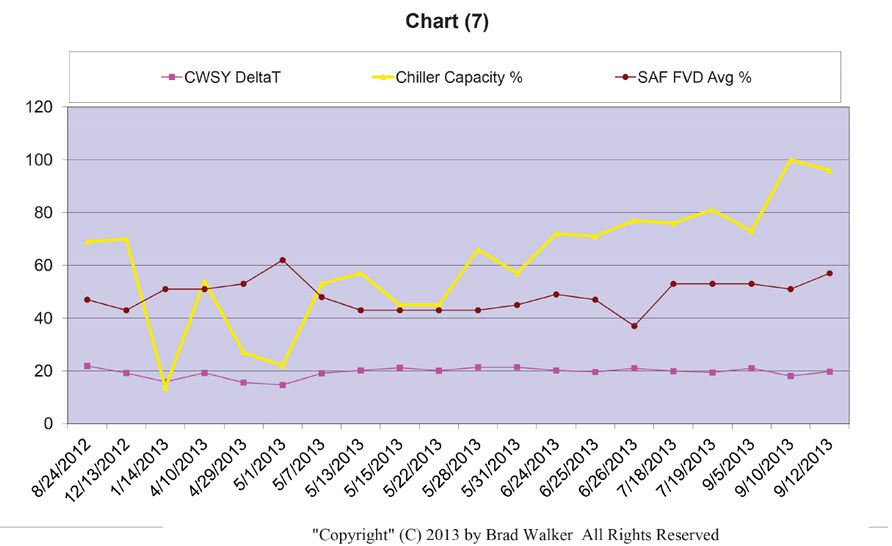
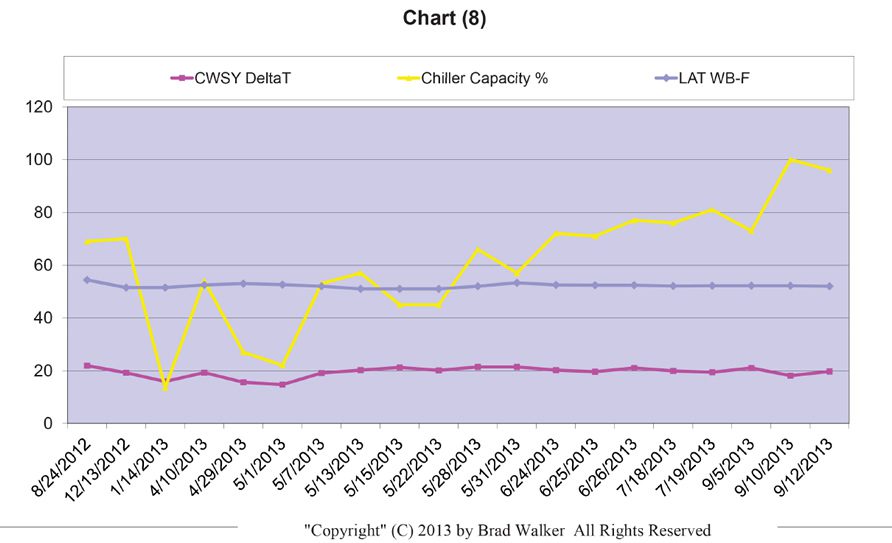
System Performance Analysis
Tim Jones, the resident operations engineer for the University, provided systems data collected through the Building Automation System (BAS). Load profiles were examined for over a year at conditions from 20% through 100% chiller capacity.
“This system meets our most demanding needs for efficiency and performance.”
— Tim Jones, Resident Operations Engineer, Salisbury University (manages 22 buildings)These observations are supported by the chilled water system’s actual temperature difference being more than 20% higher than the design of 16°F ΔT. The chilled water system operates at an average 20°F ΔT — reducing the design flow rate from 1.5 gpm/ton (16°F) to 1.20 gpm/ton (20°F). Every metric that was analyzed exceeded projections.
- Average ΔT of 20°F Exceeded the design ΔT of 16°F by more than 20% — at every load condition from startup to full load.
- Reduced flow rate Design flow reduced from 1.5 gpm/ton to 1.20 gpm/ton — directly reducing pumping energy.
- Stable AHU fan speeds Precise load tracking control kept supply air fan VFD speeds consistent and efficient across all AHUs.
- Consistent ΔT stability Temperature difference remained stable through varied AHU supply airflow and chiller capacity conditions.
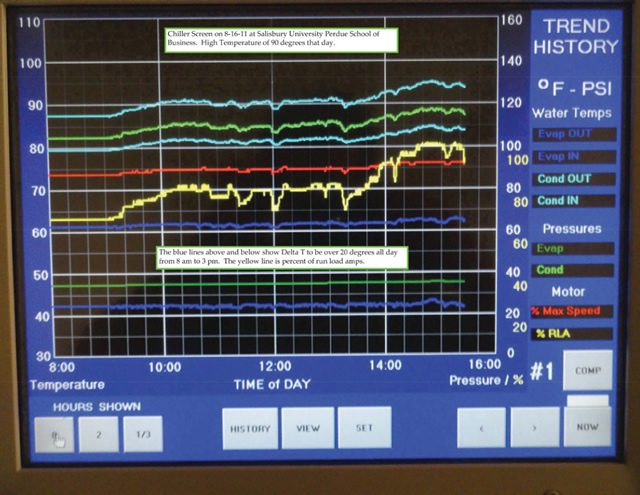
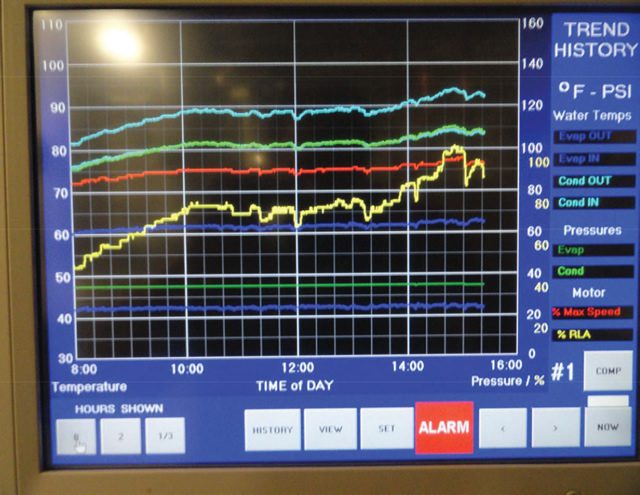
- Proven under peak load System performance confirmed even on a humid 90°F day — as shown in the onboard chiller screens (Appendix A).
“We specified pressure independent control valves and designed for a high chilled water temperature difference to improve energy efficiency and reduce pumping energy specifically. The gathered data supports the performance of the system to deliver consistently high temperature differential at varied load conditions.”
— Todd Garing, PE, Mueller Associates (Design Engineer)Questions about this application? Contact info@GriswoldControls.com or 949.559.6000
This case study was coordinated by the Griswold Controls representative in Maryland in conjunction with Oscar Walker of Green Shoots Controls.
Griswold Controls Representative — Hydro Tec
Brad Walker — (410) 404-6647
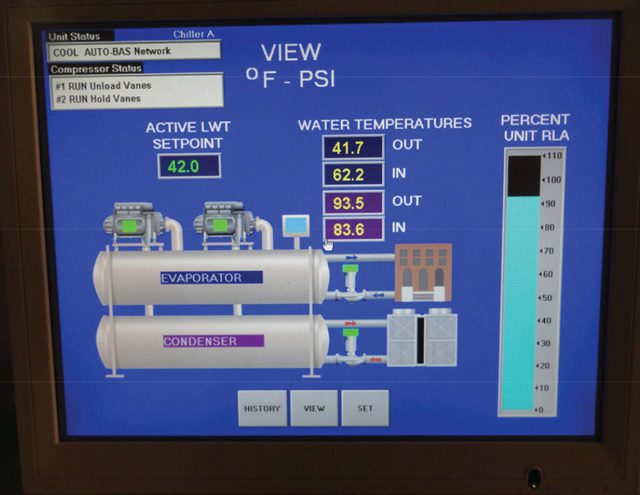
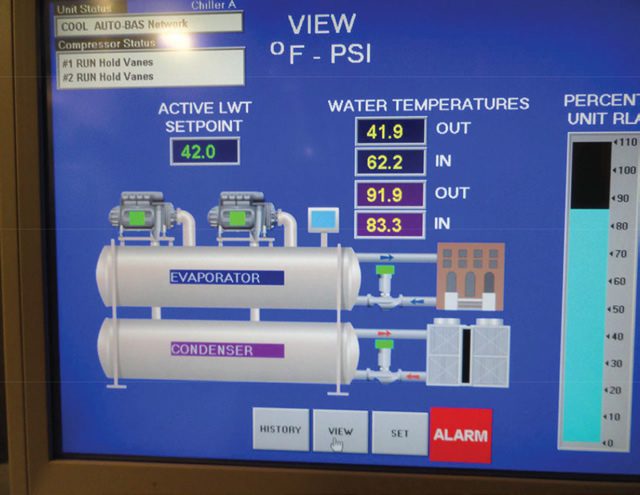
Appendix A — Chiller Screen Data
Onboard chiller screens recorded during the case study, including readings captured on a humid 90°F day. Screens are typical of system performance throughout the study period.
Appendix B — BAS Performance Graphs

Have a question about this or another Griswold Controls Case Study?
Fill out the form below and someone from Griswold Controls will get back to you shortly.